
So far I was happily using ELK stack to feed syslog messages into Elasticsearch. In ELK stack I had used Logstash to aggregate syslogs and feed them into elasticsearch.
Recently, I came across fluentd and found it quite interesting and flexible.
Using fluentd with Elasticsearch and Kibana I have now build a EFK stack.
EFK stack is opensource and free platform which can be used to store unstructured data and later use it for analytics and build visualization.
Here are the steps to build and configure this powerful analytics platform.
Download OpenJDK, Elasticsearch and Kibana
wget -c "https://download.java.net/java/GA/jdk11/9/GPL/openjdk-11.0.2_linux-x64_bin.tar.gz"

wget -c "https://artifacts.elastic.co/downloads/elasticsearch/elasticsearch-6.6.1.tar.gz"

wget -c https://artifacts.elastic.co/downloads/kibana/kibana-6.6.1-linux-x86_64.tar.gz
Explode OpenJDK, Elasticsearch and Kibana tars in /opt/efk
mkdir /opt/efk

tar xvzf openjdk-11.0.2_linux-x64_bin.tar.gz --directory /opt/efk/

tar xvzf elasticsearch-6.6.1.tar.gz --directory /opt/efk/

tar xvzf kibana-6.6.1-linux-x86_64.tar.gz --directory /opt/efk/
Create symbolic links for the extracted directories
ln -s elasticsearch-6.6.1/ elasticsearch

ln -s jdk-11.0.2/ java

ln -s kibana-6.6.1-linux-x86_64/ kibana

ls -l
total 12
lrwxrwxrwx.  1 root root   20 Mar 12 07:22 elasticsearch -> elasticsearch-6.6.1/
drwxr-xr-x.  8 root root 4096 Feb 13 17:11 elasticsearch-6.6.1
lrwxrwxrwx.  1 root root   11 Mar 12 07:23 java -> jdk-11.0.2/
drwxr-xr-x.  8 root root 4096 Mar 12 07:19 jdk-11.0.2
lrwxrwxrwx.  1 root root   26 Mar 12 07:23 kibana -> kibana-6.6.1-linux-x86_64/
drwxr-xr-x. 13 root root 4096 Mar 12 07:20 kibana-6.6.1-linux-x86_64
Add Unix users ids for elasticsearch and kibana processes
adduser --home /opt/efk/elasticsearch elasticsearch

adduser --home /opt/efk/kibana kibana
Change ownership of Elasticsearch and Kibana components
chown -R kibana:kibana /opt/efk/kibana-6.6.1-linux-x86_64/ /opt/efk/kibana

chown -R elasticsearch:elasticsearch /opt/efk/elasticsearch-6.6.1/ /opt/efk/elasticsearch
Create log directories and change ownership of log directories
mkdir /var/log/{elasticsearch,kibana}

chown -R kibana:kibana /var/log/kibana/

chown -R elasticsearch:elasticsearch /var/log/elasticsearch/
Download Fluentd (rpm or deb depending upon you are on RHEL or debian/ubuntu) from https://td-agent-package-browser.herokuapp.com/3/
wget -c http://packages.treasuredata.com.s3.amazonaws.com/3/redhat/7/x86_64/td-agent-3.3.0-1.el7.x86_64.rpmOn RHEL you may face dependency of redhat-lsb-core, fulfill this dependency by installing redhat-lsb-core.
Then Install fluentd td-agent.
rpm -Uvh td-agent-3.3.0-1.el7.x86_64.rpmNow, let us jump to the configurations of each component to complete EFK platform.
Start configuring elasticsearch.
Create data location for elasticsearch.
mkdir /data/elasticdata
chown -R elasticsearch:elasticsearch /data/elasticdata

cd /opt/efk/elasticsearch/config
Edit “elasticsearch.yml” config file
Give some nodename and set data path, log path
node.name: mysmartanalytics
path.data=/data/elasticdata
path.logs: /var/log/elasticsearc
You can tune Java memory options in jvm.options config file.
Now, let us configure Kibana
cd /opt/efk/kibana/configEdit “kibana.yml” config file
server.name: "mysmartnalytics"Now, let us run Elasticsearch and Kibana processes before Fluentd config.
Elasticsearch startup
su - elasticsearch -c "export JAVA_HOME=/opt/efk/java/;export ES_PATH_CONF=/opt/efk/elasticsearch/config/; /opt/efk/elasticsearch/bin/elasticsearch -v &"List elasticsearch indices, though it wont return any index but will confirm if startup is good.
curl -XGET "http://localhost:9200/_cat/indices?v"

health status index uuid pri rep docs.count docs.deleted store.size pri.store.size
Upon startup logs will go in /var/log/elasticsearch/
Kibana startup
su - kibana -c "export JAVA_HOME=/opt/efk/java/; /opt/efk/kibana/bin/kibana -c /opt/efk/kibana/config/kibana.yml -l /var/log/kibana/kibana.log &"Moment you start Kibana, again list elasticsearch indices and you will see Kibana creates its own index in elasticsearch.
curl -XGET "http://localhost:9200/_cat/indices?v"

health status index     uuid                   pri rep docs.count docs.deleted store.size pri.store.size
green  open   .kibana_1 901xy-VVSiOq07hD572FmA   1   0          1            0        5kb            5kb
It is always a good idea to expose Kibana and elasticsearch (for RESTFul access) on network interface through some HTTP proxy. You can also add HTTP basic authentication and source IP whitelisting for elasticsearch and kibana in proxy config.
You can use apache webserver as inbound HTTP proxy. Add following lines to your apache config.
ProxyRequests On

<Location />
        ProxyPass http://127.0.0.1:5601/
        ProxyPassReverse http://127.0.0.1:5601/
</Location>

<Location /elastic>
        ProxyPass http://127.0.0.1:9200/
        ProxyPassReverse http://127.0.0.1:9200/
        Deny from All
        Allow from 127.0.0.1
        Allow from 192.168.0.23
        Allow from 192.168.0.25
</Location>
Restart apache service
systemctl restart httpd.serviceKeep looking into apache logs
tail -f /var/log/httpd/access_logNow, let us test this setup.
You can use any browser, but in during development and testing I suggest to use curl tool.
Access Elasticsearch through proxy url of elastricsearch
curl -v -L http://your_host_ip/elastic
* About to connect() to your_host_ip port 80 (#0)
*   Trying your_host_ip...
* Connected to your_host_ip (your_host_ip) port 80 (#0)
> GET /elastic HTTP/1.1
> User-Agent: curl/7.29.0
> Host: your_host_ip
> Accept: */*
>
< HTTP/1.1 200 OK
< Date: Tue, 12 Mar 2019 09:39:40 GMT
< Server: Apache/2.4.6 (SLES Expanded Support platform) OpenSSL/1.0.2k-fips mod_fcgid/2.3.9
< content-type: application/json; charset=UTF-8
< content-length: 497
<
{
  "name" : "mystartanalytics",
  "cluster_name" : "elasticsearch",
  "cluster_uuid" : "vUXDDln7TUuS_1DL5YE1bQ",
  "version" : {
    "number" : "6.6.1",
    "build_flavor" : "default",
    "build_type" : "tar",
    "build_hash" : "1fd8f69",
    "build_date" : "2019-02-13T17:10:04.160291Z",
    "build_snapshot" : false,
    "lucene_version" : "7.6.0",
    "minimum_wire_compatibility_version" : "5.6.0",
    "minimum_index_compatibility_version" : "5.0.0"
  },
  "tagline" : "You Know, for Search"
}
Access kibana through proxy url of kibana
curl -v -L http://your_host_ip/

* About to connect() to your_host_ip port 80 (#0)
*   Trying your_host_ip...
* Connected to your_host_ip (your_host_ip) port 80 (#0)
> GET / HTTP/1.1
> User-Agent: curl/7.29.0
> Host: your_host_ip
> Accept: */*
>
< HTTP/1.1 302 Found
< Date: Tue, 12 Mar 2019 09:36:35 GMT
< Server: Apache/2.4.6 (SLES Expanded Support platform) OpenSSL/1.0.2k-fips mod_fcgid/2.3.9
< location: /app/kibana
< kbn-name: kibana
< kbn-xpack-sig: 126a568e0707377747401e2824d2f268
< content-type: text/html; charset=utf-8
< cache-control: no-cache
< content-length: 0
<
* Connection #0 to host your_host_ip left intact
* Issue another request to this URL: 'http://your_host_ip/app/kibana'
* Found bundle for host your_host_ip: 0x1dbbe50
* Re-using existing connection! (#0) with host your_host_ip
* Connected to your_host_ip(your_host_ip) port 80 (#0)
> GET /app/kibana HTTP/1.1
> User-Agent: curl/7.29.0
> Host: your_host_ip
> Accept: */*
>
< HTTP/1.1 200 OK
Now you can use kibana on any browser to see if all looks good so far.
Let us start Fluentd config
cd /etc/td-agent/Take backup of default config
cp td-agent.conf td-agent.conf.backupHere, we will prepare Fluentd config to accept events via RESTFUL calls. You can explore other input and output mechanisms of Fluentd as well.
cat td-agent.conf
<source>
  @type http
  @id input_http
  port 8080
#  bind 0.0.0.0
#  body_size_limit 32m
#  keepalive_timeout 10s
</source>

<match mka.event>
  @type copy
  <store>
    @type elasticsearch
    include_tag_key true
    host localhost
    port 9200
    logstash_format true
    logstash_prefix mka
  </store>
</match>
Above config will accept events over RESTful calls with json payload. Each json payload having “mka.event” tag will be matched and pushed into elasticsearch datastore. You can have more tags in REST calls and match them to desired processing units of Fluentd. You can also mention index prefix in logstash_prefix parameter in each match section.
Restart td-agent
/etc/init.d/td-agent restarttd-agent logs go in
tail -f /var/log/td-agent/td-agent.logLet us push some data over REST interface to test.
Generic syntax is like:
curl -X POST -d ‘json={json payload}’ http://your_host_ip:port/some.tag
curl -X POST -d 'json={"PET":"DOG","BREED":"Pug","SIZE":"Short","FOOD":"VEG"}' http://192.168.0.23:8080/mka.event

curl -X POST -d 'json={"Plant":"Xmas tree","Indoor":"yes","LeafType":"Spines"}' http://192.168.0.23:8080/mka.event
Now, let us verify if index with prefix “mka” is created in elasticsearch.
curl -XGET "http://localhost:9200/_cat/indices?v"

health status index          uuid                   pri rep docs.count docs.deleted store.size pri.store.size

yellow open   mka-2019.03.12 1Wnyeb9tSMyFvtyDSCTVJg   5   1          2            0     12.1kb         12.1kb

green  open   .kibana_1      901xy-VVSiOq07hD572FmA   1   0          2            0      8.6kb          8.6kb
If you want to restrict access of fluentd REST interface to certain IP addresses and also want to add authentication on REST calls, then you can bind to 127.0.0.1 port 8080 in td-agent.conf and put 127.0.0.1:8080 behind HTTP proxy.
<source>
  @type http
  @id input_http
  port 8080
  bind 127.0.0.1
#  body_size_limit 32m
#  keepalive_timeout 10s
</source>
<Location /fluentd>
        ProxyPass http://127.0.0.1:8080
        ProxyPassReverse http://127.0.0.1:8080
       Deny from All
       Allow from 127.0.0.1
       Allow from 192.168.0.23
       Allow from 192.168.0.25
</Location>
Let us search the data now.
curl -XGET "http://127.0.0.1:9200/_search" -H 'Content-Type: application/json' -d'
{
  "size": 100,
    "query": {
        "range" : {
            "@timestamp" : {
                "gte": "now-1d",
                "lte": "now",
                "format": "HH:mm:ss dd/MM/yyyy "
            }
        }
    }
}'
Output:
{
"took":0,
"timed_out":false,
"_shards":{
"total":6,
"successful":6,
"skipped":0,
"failed":0
},
"hits":{
"total":2,
"max_score":1.0,
"hits":[
{
"_index":"mka-2019.03.12",
"_type":"fluentd",
"_id":"TNNxcWkBeQURKlY1UfB4",
"_score":1.0,
"_source":{
"PET":"DOG",
"BREED":"Pug",
"SIZE":"Short",
"FOOD":"VEG",
"@timestamp":"2019-03-12T10:26:22.845303539+00:00",
"tag":"mka.event"
}
},
{
"_index":"mka-2019.03.12",
"_type":"fluentd",
"_id":"TdNxcWkBeQURKlY1UfB4",
"_score":1.0,
"_source":{
"Plant":"Xmas tree",
"Indoor":"yes",
"LeafType":"Spines",
"@timestamp":"2019-03-12T10:27:17.473281491+00:00",
"tag":"mka.event"
}
}
]
}
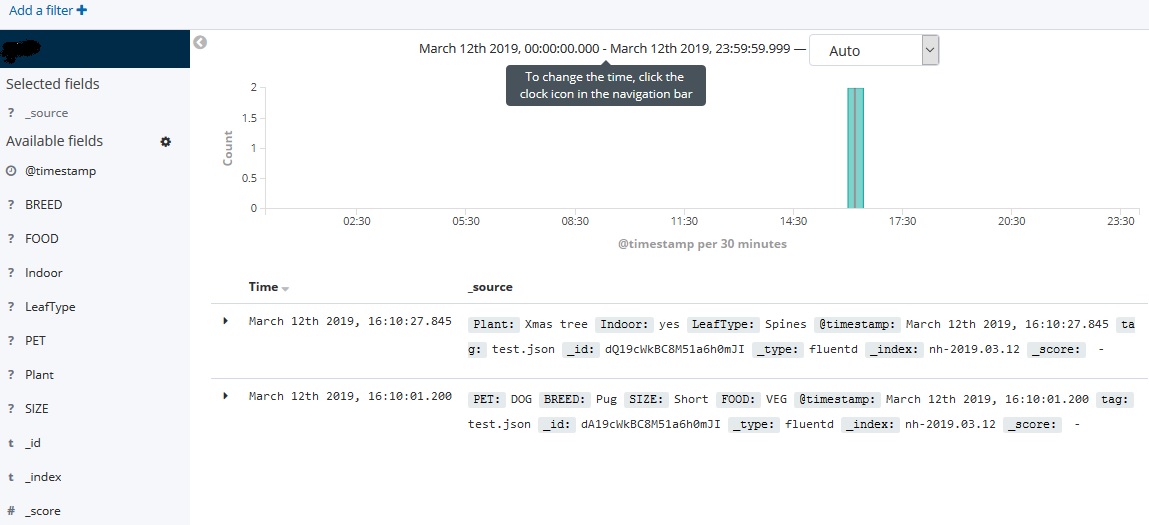
}You can visualize same data in Kibana as well.
I will further explore to use this platform for SIEM and IoT data analysis and visualisation.