I had build an IoT enabled weather station. Now let us build a nice platform to store time series data coming out of DTH22 (weather sensor) on NodeMCU and visualize it into Grafana.
I have installed and configured influxdb and Grafana onto my raspberry pi which also hosts my MQTT broker.
Weather station code transmits weather data on “weatherdata” topic in “temp, humidity, location” format. I have used small python code to capture this data over MQTT subscription and insert it into influxdb. Here is the code.
Create influxdb database and user for capturing weather data
>create database weatherdata
>CREATE USER dbuser WITH PASSWORD 'dbpass' WITH ALL PRIVILEGES
>grant all on weatherdata to dbuser
As soon as your first record is inserted in above database you will notice that “weather” measurement is created by virtue of json object created by subsequent code. This measurement holds your time series data.
> use weatherdata
Using database weatherdata
> show measurements
name: measurements
name
----
weather
>
#!/usr/bin/python3

import paho.mqtt.client as paho
from datetime import datetime
import time
import logging
import json
import subprocess

broker="mqtt broker"
port=1883
topic="weatherdata"
username="mqtt user"
password="mqtt password"

logger = logging.getLogger(__name__)
logger.setLevel(logging.DEBUG)
# log weather data in a logfile
handler = logging.FileHandler('/var/log/weatherinflux.log')  # create a file handler
formatter = logging.Formatter('%(asctime)s - %(levelname)s - %(message)s') # create a logging format
handler.setFormatter(formatter)
logger.addHandler(handler)# add the handlers to the logger

def on_subscribe(client, userdata, mid, granted_qos):
#       print("Subscribed: "+str(mid)+" "+str(granted_qos))
    print("Waiting for message weather data...")

def on_message(client, userdata, mqttmsg):
    print(mqttmsg.topic+" "+str(mqttmsg.qos)+" "+mqttmsg.payload.decode("utf-8"))

    if mqttmsg.topic == 'weatherdata':
         temp, humidity, location=mqttmsg.payload.decode("utf-8").split(',')
         weatherdata=mqttmsg.payload.decode("utf-8")
# invoking my generic program to insert data into influxdb. I had tried calling influxdb json commit in MQTT loop directy but it didnt worked and I am still wondering why it just fails silently.
         subprocess.run(["/opt/tools/weatherdata/influxit.py", temp, humidity, location])
         print(weatherdata.split(','))
         logger.info(weatherdata.split(','))

client = paho.Client()
client.username_pw_set(username, password)
client.on_subscribe = on_subscribe
client.on_message = on_message
client.connect(broker, port)
client.subscribe(topic)
client.loop_forever()
Code to insert form json from cli parameters and insert it into influxdb, this is being invoked within above program.
#!/usr/bin/python3

from influxdb import InfluxDBClient
from datetime import datetime
import json
import sys

client=InfluxDBClient(host='127.0.0.1', port=8086, database='weatherdata',username='dbuser', password='dbpass')

temp=sys.argv[1]
humidity=sys.argv[2]
location=sys.argv[3]

#weatherdata="sys.argv[1]"
#temp, humidity, location=weatherdata.split(',')

current_time=datetime.utcnow().strftime('%Y-%m-%dT%H:%M:%SZ')
#print(current_time)

current_time=datetime.utcnow().strftime('%Y-%m-%dT%H:%M:%SZ')
payload=[
  {
            "measurement": "weather",
            "tags": {
                "location": location
            },
            "time": current_time,
            "fields": {
                "temp": float(temp),
                "humidity": float(humidity)
            }
       }
]
#print(payload)
client.write_points(payload)
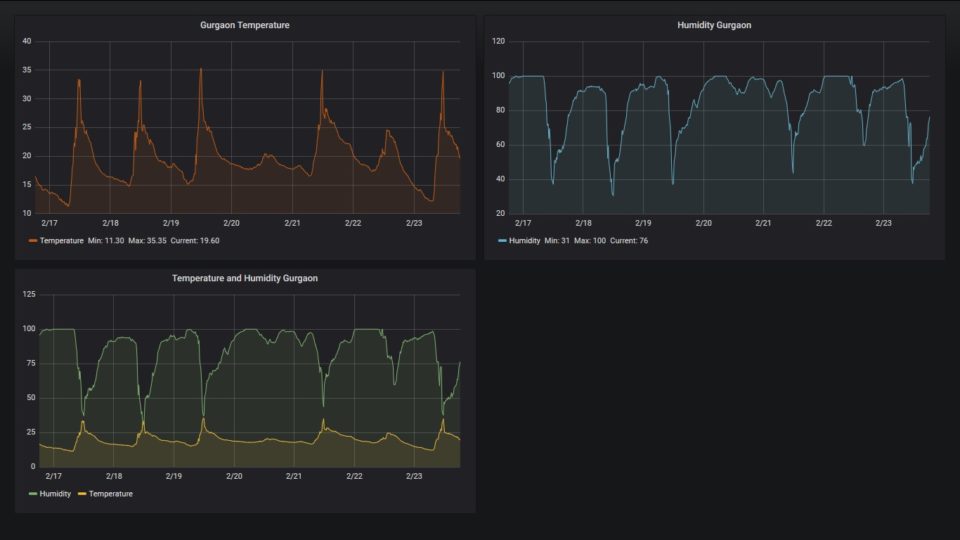
Once you start receiving data in “weather” measurement you are ready to configure Grafana. In Grafana add a “Influxdb” datasource and point it to “weatherdata” database. Then create a new dashboard and a graph on new dashboard. Grafana configuration at this point is straight forward. I have created three graphs. Temperature, Humidity and temperature humidity combined to see relation.