
These days many private housing complexes are providing pre-paid system for electricity and other charges. In our society we have similar arrangement. But there is lack of transparency and sometimes service provider tend to deduct amount for no reason or they charge for generator power consumption while grid supply was available.
To monitor such situation I thought of building a solution wherein I can capture data and plot various parameters every hour and flag any suspicious deduction or trend in graphs.
Create sqlite database using following schema
CREATE TABLE elec_cam (poll_timestamp DATETIME default (DATETIME(CURRENT_TIMESTAMP, ‘LOCALTIME’)), Unit_Num INT,Tower CHAR(3),KWH_Mains REAL,KWH_DG REAL,Sanction_Load_Mains REAL,Sanction_Load_DG REAL, Last_Billed_Opening_Balance_INR REAL,Last_Billed_Opening_CAM_Balance_INR REAL,Last_Billed_Unit_Mains REAL,Last_Billed_Unit_DG REAL,Live_Balance_Main_INR REAL,Live_Balance_Cam_INR REAL);
Index timestamp for faster search
CREATE INDEX poll_timestamp_index ON elec_cam (poll_timestamp);
Poll service provider portal at fix interval ( 1 hr in my case)
#!/bin/bash
# To read read from electricy and maintenance portal, dump it database and plot realtime graphs
# Manish Kumar Arya m@mka.in www.mka.in
curl -c /tmp/pescookie.txt “http://pesonline.co.in/orris/login.php” -d “UserId=your_username” -d “password=your_password” -d “Submit=Login” > /dev/null
value=$(curl -j -b /tmp/pescookie.txt http://pesonline.co.in/orris/sphinx.php | html2text | awk ‘/current meter reading/{flag=1;next}/Current Month Coupon Recharge Detail/{flag=0}flag’ | tr -dc ‘\n0-9-‘ | tr ‘\n’ ‘;’)
Unit_Num=”902″
Tower=”D5″
KWH_Mains=$(scale=2;echo “$(echo $value | cut -d “;” -f1)/100″ | bc)
KWH_DG=$(scale=2;echo “$(echo $value | cut -d “;” -f2)/100″ | bc)
Sanction_Load_Mains=$(echo “scale=2;$(echo $value | cut -d “;” -f3)/100″ | bc)
Sanction_Load_DG=$(echo “scale=2;$(echo $value | cut -d “;” -f4)/100″ | bc)
Last_Billed_Opening_Balance_INR=$(echo “scale=2;$(echo $value | cut -d “;” -f5)/100″ | bc)
Last_Billed_Opening_CAM_Balance_INR=$(echo “scale=2;$(echo $value | cut -d “;” -f6)/100″ | bc)
Last_Billed_Unit_Mains=$(echo “scale=2;$(echo $value | cut -d “;” -f7)/100″ | bc)
Last_Billed_Unit_DG=$(echo “scale=2;$(echo $value | cut -d “;” -f8)/100″ | bc)
Live_Balance_Main_INR=$(echo “scale=2;$(echo $value | cut -d “;” -f9)/100″ | bc)
Live_Balance_Cam_INR=$(echo “scale=2;$(echo $value | cut -d “;” -f10)/100″ | bc)
logger “PES_UPDATE: $Unit_Num,$Tower,$KWH_Mains,$KWH_DG,$Sanction_Load_Mains,$Sanction_Load_DG,$Last_Billed_Opening_Balance_INR,$Last_Billed_Opening_CAM_Balance_INR,$Last_Billed_Unit_Mains,$Last_Billed_Unit_DG,$Live_Balance_Main_INR,$Live_Balance_Cam_INR”
echo “INSERT INTO elec_cam(poll_timestamp,Unit_Num,Tower,KWH_Mains,KWH_DG,Sanction_Load_Mains,Sanction_Load_DG,Last_Billed_Opening_Balance_INR,Last_Billed_Opening_CAM_Balance_INR,Last_Billed_Unit_Mains,Last_Billed_Unit_DG,Live_Balance_Main_INR,Live_Balance_Cam_INR) VALUES (datetime(CURRENT_TIMESTAMP, ‘localtime’),$Unit_Num,’$Tower’,$KWH_Mains,$KWH_DG,$Sanction_Load_Mains,$Sanction_Load_DG,$Last_Billed_Opening_Balance_INR,$Last_Billed_Opening_CAM_Balance_INR,$Last_Billed_Unit_Mains,$Last_Billed_Unit_DG,$Live_Balance_Main_INR,$Live_Balance_Cam_INR);” | sqlite3 /opt/tools/elecam/elec_cam.sqlt
rm -f /tmp/pescookie.txt
Cronjob to run above poller
0 * * * * /opt/tools/elecam/pollpes.sh
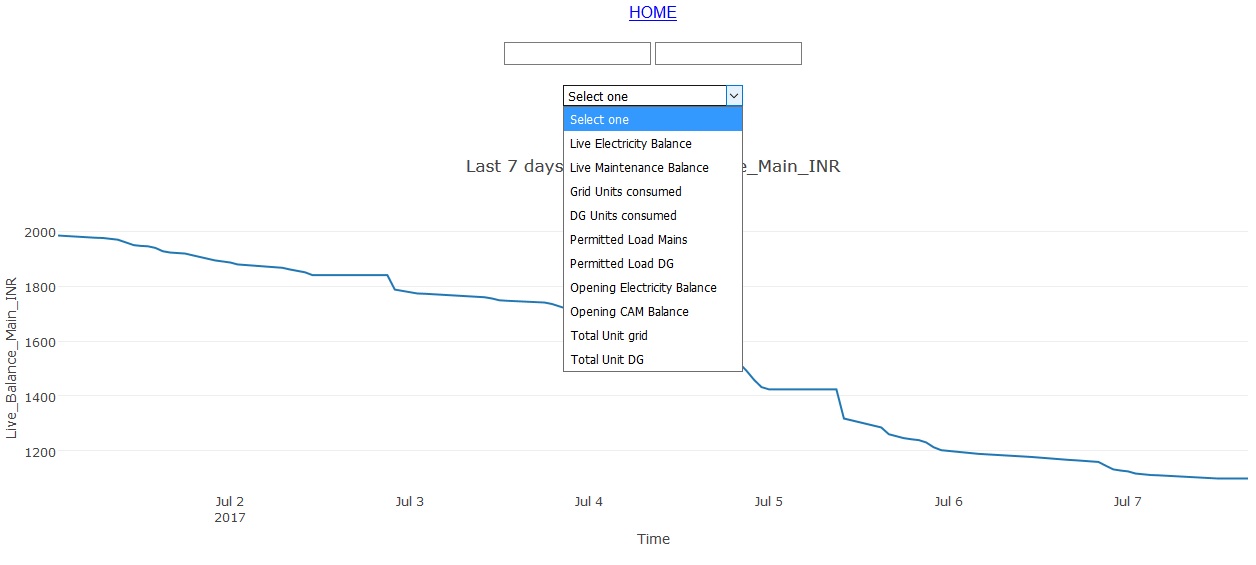
Place this script in your apache document root to plot timescale graph of various parameters captured from portal
<?php
/*
To read read from electricy and maintenance portal, dump it database and plot realtime graphs
Manish Kumar Arya m@mka.in www.mka.in
*/
$fieldname=$_POST[“option”];
$fromdate=$_POST[“fromdate”];
$todate=$_POST[“todate”];
if (!isset($fieldname)) {
$fieldname=”Live_Balance_Main_INR”;
}
$db = new SQLite3(‘/opt/tools/elecam/elec_cam.sqlt’);
if (!isset($fromdate) or $fromdate == “Start date” or $fromdate == “”) {
// $query_statement=”SELECT * FROM elec_cam where poll_timestamp between date(‘now’,’-7 day’) and date(‘now’)”;
$results = $db->query(‘SELECT * FROM elec_cam where poll_timestamp between date(\’now\’,\’-6 day\’) and date(\’now\’,\’+1 day\’)’);
}
else
{
$query_statement=”SELECT * FROM elec_cam where poll_timestamp between ‘$fromdate’ and ‘$todate'”;
$results = $db->query($query_statement);
}
//print “$query_statement”;
//print “$fromdate, $todate”;
$query_statement=”SELECT * FROM elec_cam where poll_timestamp between ‘$fromdate’ and ‘$todate'”;
//$results = $db->query($query_statement);
//select poll_timestamp,KWH_Mains from elec_cam where poll_timestamp between ‘2017-06-28’ and ‘2017-07-01’;
$field = array();
$timevalue= array();
while ($row = $results->fetchArray()) {
array_push($timevalue, $row[‘poll_timestamp’]);
array_push($field, $row[“$fieldname”]);
// var_dump($row);
}
//print_r($timevalue);
//print_r($field);
?>
<html>
<title>Electricity and maintenance</title>
<head>
<!– Plotly.js –>
<script src=”https://cdn.plot.ly/plotly-latest.min.js”></script>
</head>
<body>
<meta charset=”utf-8″>
<meta name=”viewport” content=”width=device-width, initial-scale=1″>
<title>jQuery UI Datepicker – Default functionality</title>
<link rel=”stylesheet” href=”//code.jquery.com/ui/1.12.1/themes/base/jquery-ui.css”>
<link rel=”stylesheet” href=”/resources/demos/style.css”>
<script src=”https://code.jquery.com/jquery-1.12.4.js”></script>
<script src=”https://code.jquery.com/ui/1.12.1/jquery-ui.js”></script>
<script>
$( function() {
$( “#fromdate” ).datepicker({ dateFormat: ‘yy-mm-dd’});
} );
</script>
<script>
$( function() {
$( “#todate” ).datepicker({ dateFormat: ‘yy-mm-dd’});
} );
</script>
<center>
<a href=index.php><font face=arial color=blue>HOME</font></a>
<br><br>
<form action=”index.php” method=”post”>
<input type=date id=fromdate name=fromdate value=”Start date”>
<script type=”text/javascript”>
document.getElementById(‘fromdate’).value = “<?php echo $_POST[‘fromdate’];?>”;
</script>
<input type=date id=todate name=todate value=”End date”>
<script type=”text/javascript”>
document.getElementById(‘todate’).value = “<?php echo $_POST[‘todate’];?>”;
</script>
<br><br>
<select name=”option” onchange=”this.form.submit()”>
<option value=”SelectItem”>Select one</option>
<option value=”Live_Balance_Main_INR”>Live Electricity Balance</option>
<option value=”Live_Balance_Cam_INR”>Live Maintenance Balance</option>
<option value=”KWH_Mains”>Grid Units consumed</option>
<option value=”KWH_DG”>DG Units consumed</option>
<option value=”Sanction_Load_Mains”>Permitted Load Mains</option>
<option value=”Sanction_Load_DG”>Permitted Load DG</option>
<option value=”Last_Billed_Opening_Balance_INR”>Opening Electricity Balance</option>
<option value=”Last_Billed_Opening_CAM_Balance_INR”>Opening CAM Balance</option>
<option value=”Last_Billed_Unit_Mains”>Total Unit grid</option>
<option value=”Last_Billed_Unit_DG”>Total Unit DG</option>
</select>
</form>
</center>
<!– Plotly chart will be drawn inside this DIV –>
<div id=”graphDiv”></div>
<script>
var xarr = <?php echo json_encode($timevalue); ?>;
var yarr = <?php echo json_encode($field); ?>;
console.log(xarr);
var trace1 = {
x: xarr,
y: yarr,
type: ‘scatter’,
mode: ‘lines’,
};
var data = [trace1];
var layout = {
title: “<?php
if (!isset($fromdate) or $fromdate == “Start date” or $fromdate == “”)
{
print “Last 7 days data of $fieldname”;
}
else
{
print “$fieldname from $fromdate to $todate”;
}
?>”,
xaxis: {
title: ‘Time’,
showgrid: false,
zeroline: false
},
yaxis: {
title: “<?php echo $fieldname?>”,
showline: false
}
};
Plotly.newPlot(graphDiv, data, layout);
</script>
</body>
</html>
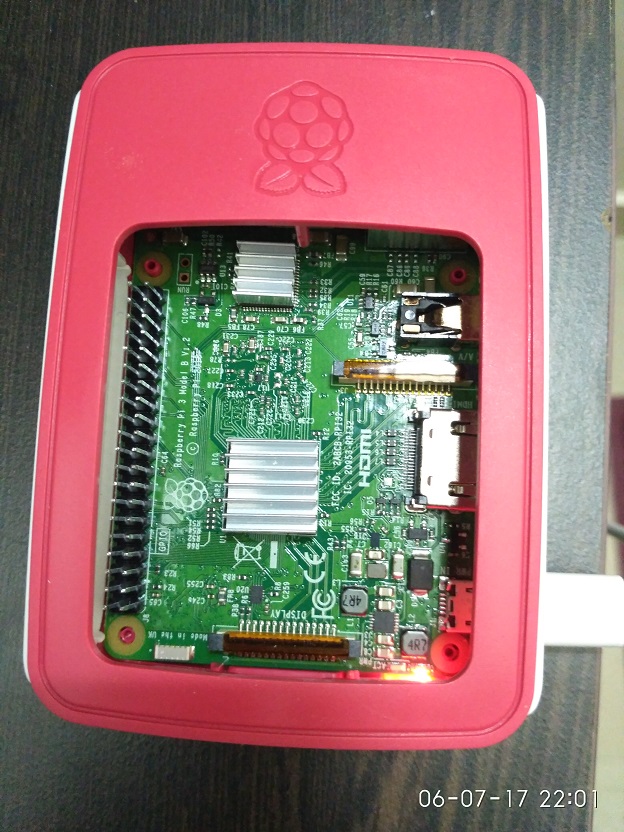 I am running solution on raspberry-pi and have configured DDNS and Virtual server on my internet router to access it from internet (that is another story 🙂 )