Grafana
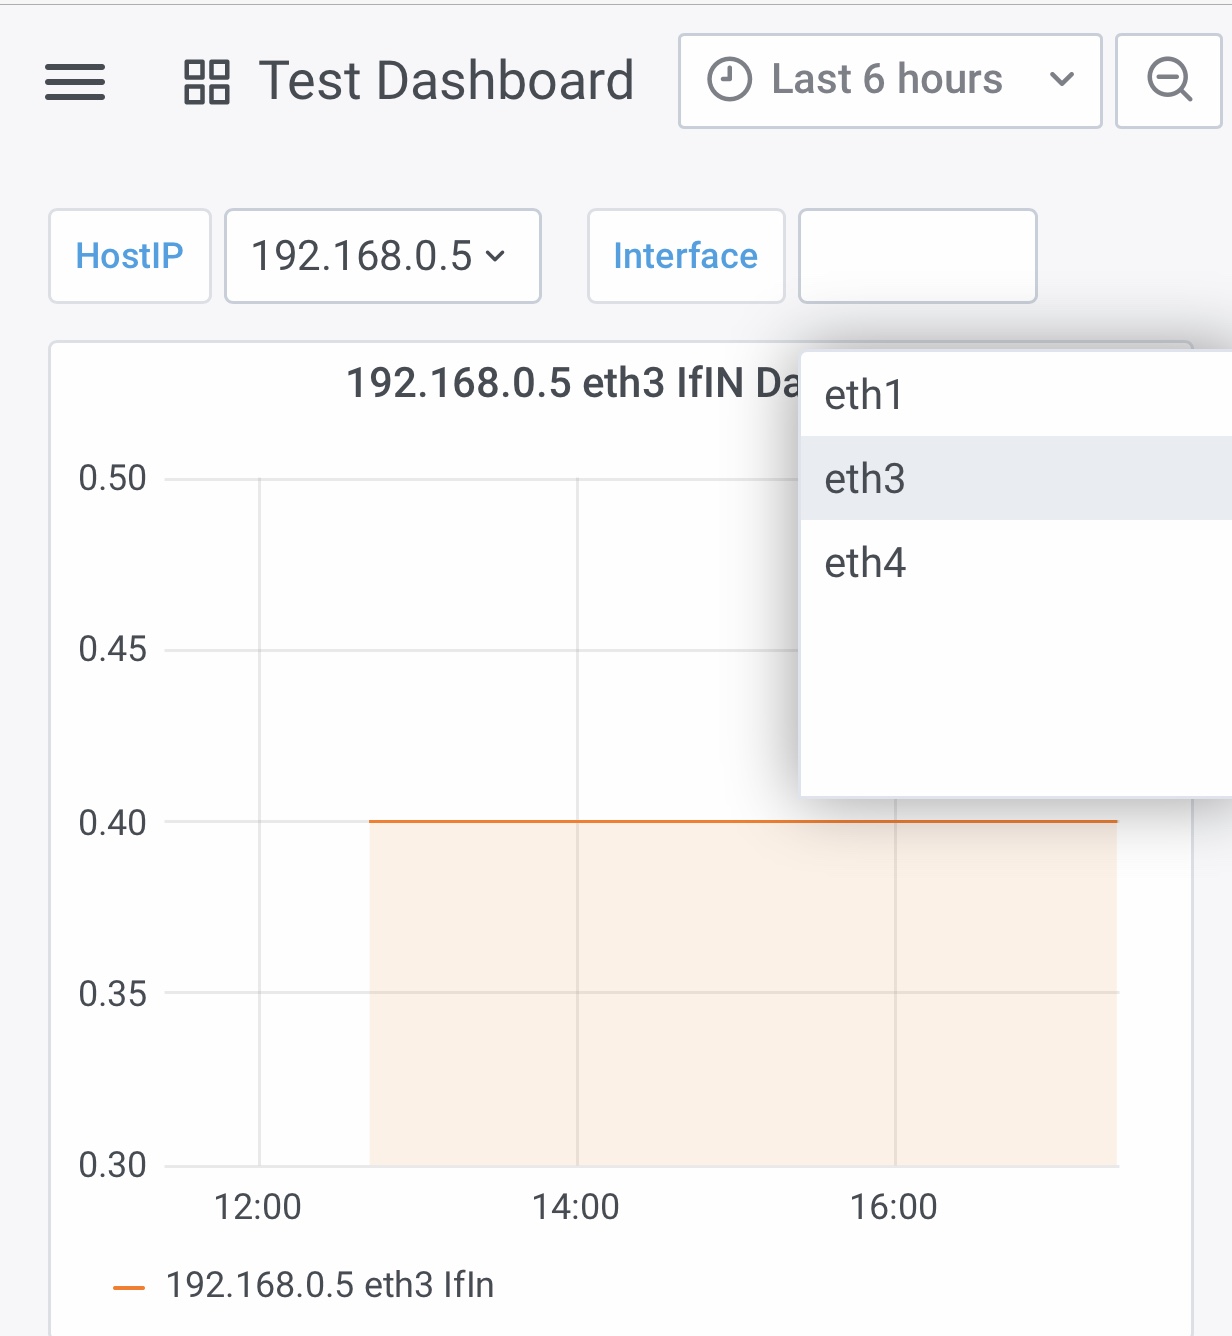
Nested variables in Grafana

Quite often you want to use one variable of Grafana as input in query to derive next variable value set. Think of a typical example, you have 10 host machines and each host has several network interfaces. And you want to display stats of each interface of selected host. Now, when you select “host” variable […]
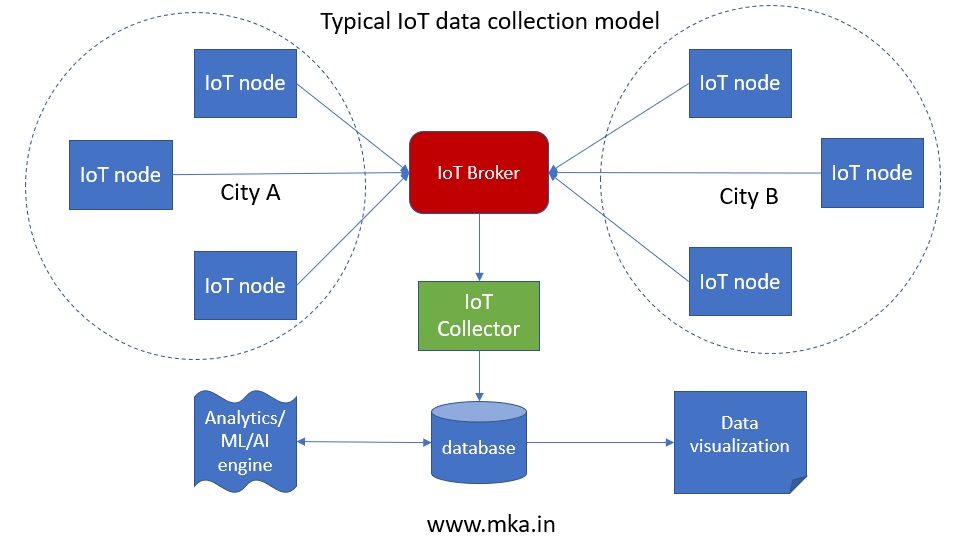
Multi topic IoT subscriber model
In a typical IoT model, you have many IoT sensors publishing data to IoT broker. You may want to collect data from all these IoT nodes in a database for visualization and further analytics. I have couple of IoT nodes installed in two houses in two different cities. And I collect data from all IoT […]
Monitor power usage and other parameters of Linux server
This weekend I decided to exchange my 8 year old i3 laptop with a desktop. I was offered an HP elite 8300 small form factor desktop in exchange of laptop and 7000 Rs. So far I was using raspberry pi 3 for hosting web based apps and running some other programs 24×7. I mainly opted […]
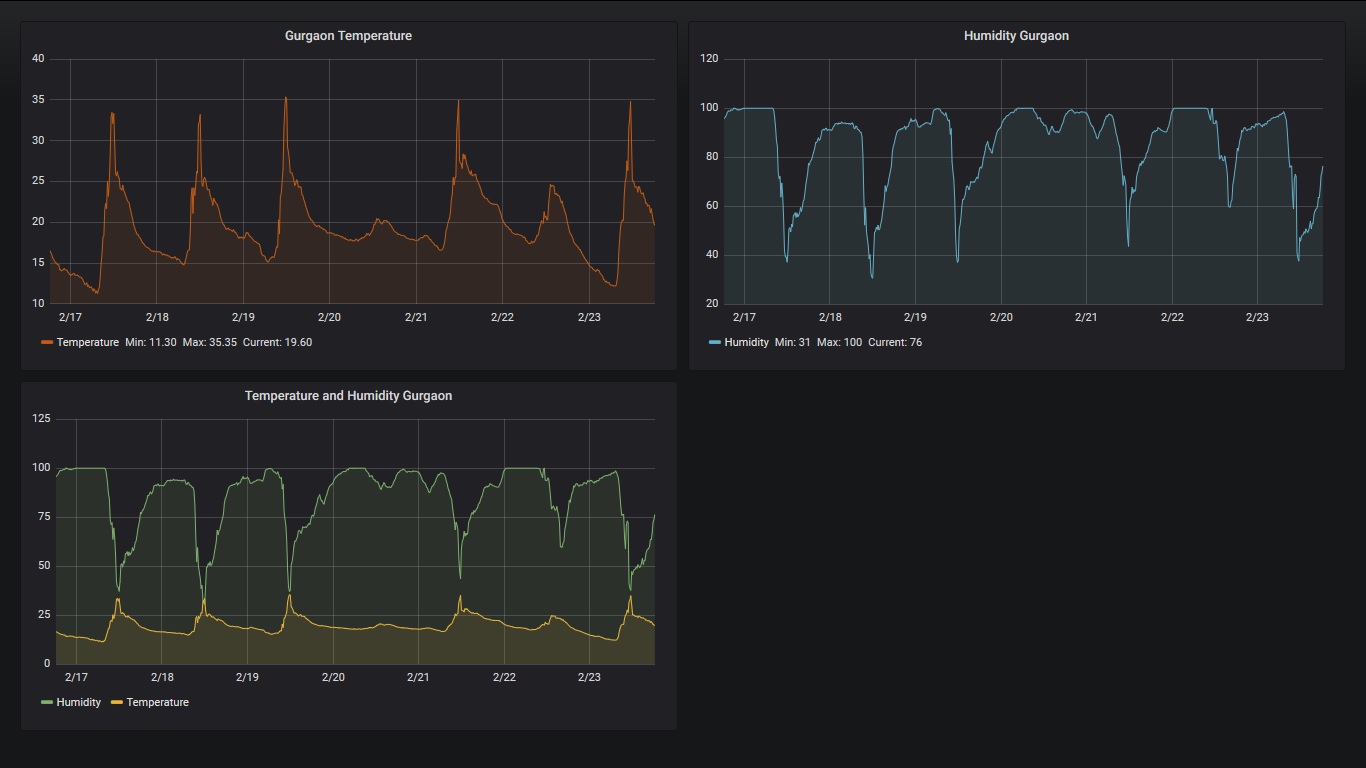
Publish IoT data in Influxdb and visualize in Grafana
I had build an IoT enabled weather station. Now let us build a nice platform to store time series data coming out of DTH22 (weather sensor) on NodeMCU and visualize it into Grafana. I have installed and configured influxdb and Grafana onto my raspberry pi which also hosts my MQTT broker. Weather station code transmits […]