This weekend I decided to exchange my 8 year old i3 laptop with a desktop. I was offered an HP elite 8300 small form factor desktop in exchange of laptop and 7000 Rs. So far I was using raspberry pi 3 for hosting web based apps and running some other programs 24×7. I mainly opted for pi boards due to low power consumption and convenience of throwing them anywhere in home.
This HP 8300 machine has good specifications for developing ML, AL and image processing programs.
- i7 3rd generation CPU
- 8 GB Memory
- 500 GB 7200 rpm disk
Being unsure of power usage, I decided to write something to monitor its power usage.
Using s-tui tool, python, Influxdb and grafana I have developed this solution. To start first install s-tui tool.
pip3 install --no-cache s-tui

Collecting s-tui
  Downloading https://files.pythonhosted.org/packages/f4/43/d02518a7a3c178b04adbc813ed0959c7d89bff0fd6921286bb431de5649a/s-tui-0.8.3.tar.gz
Requirement already satisfied: psutil>=5.2.0 in /usr/local/lib/python3.7/dist-packages (from s-tui) (5.4.7)
Requirement already satisfied: urwid>=1.3.1 in /usr/local/lib/python3.7/dist-packages (from s-tui) (2.0.1)
Installing collected packages: s-tui
  Running setup.py install for s-tui ... done
Successfully installed s-tui-0.8.3
Followed by creating influxdb database and database user. Also set retention policy to whatever you like. I have enabled REST on my influxdb. You may refer it here.
create database cpumon

create user myuser with password 'mypass' with all privileges

grant all on cpumon to myuser

# Set retention to 7 days
CREATE RETENTION POLICY "one week data" ON "cpumon" DURATION 7d replication 1
Now here is the final python program which will pull CPU parameters using s-tui tool and dump them in influxdb timeseries database. I am collecting data every 2 min by running this code in cron.
#!/usr/bin/python3
import os
import subprocess
import re
import requests
from requests.auth import HTTPBasicAuth
# Influxdb REST URI with cpumon db name in write parameter
dburi='http://xx.xx.xx.xx:8086/write?db=cpumon'
# source compueter/server/system
compname='scorpio'
# Form cmd
cpucmd = '/usr/local/bin/s-tui -t'
#Execute it in shell
outdata = subprocess.check_output("s-tui -t", shell=True)
#Convert byte output to string
outdata=str(outdata,'utf-8')
# Extract float values out of output, remember to check order of fields
values=re.findall(r"[-+]?\d*\.\d+|\d+", outdata)
# assign values to respective parameters out of values list
topfreq,curfreq,preflost,curtemp,maxtemp,utiperc,curpwr,maxpwr=values[0:]
# Verify each parameter value
#print(topfreq,curfreq,preflost,curtemp,maxtemp,utiperc,curpwr,maxpwr)
# Prepare influxdb database load statement in cpumon_data measurement and compname as tag
dbpayload='cpumon_data,compname='+compname+' topfreq='+topfreq+',curfreq='+curfreq+',curtemp='+curtemp+',utiperc='+utiperc+',curpwr='+curpwr
# Push data using authenticated REST
dbres=requests.post(dburi, data=dbpayload, auth=HTTPBasicAuth('myuser', 'mypass'))
#Print response from influx server
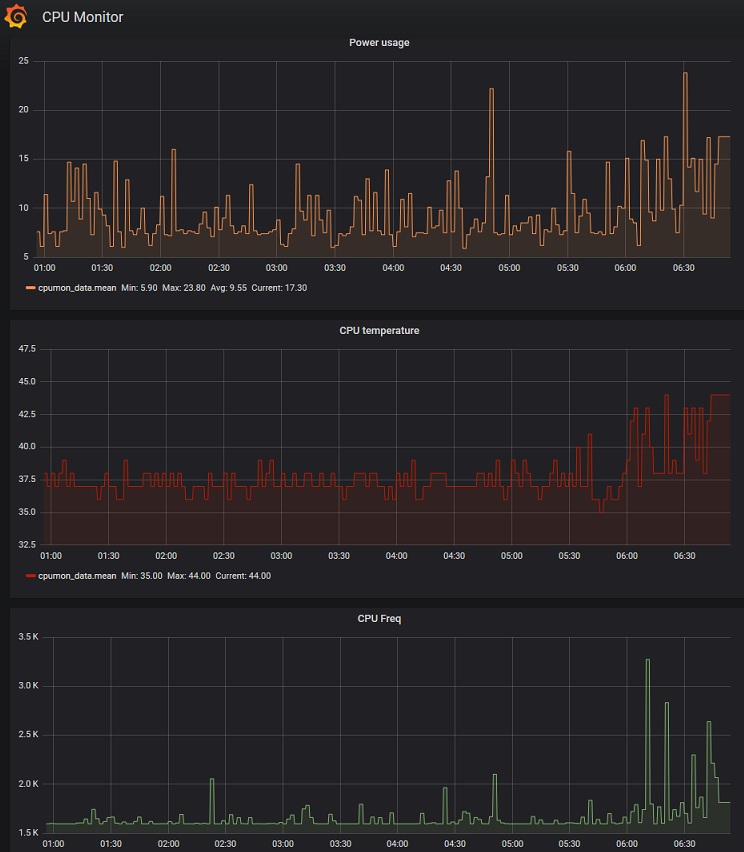
print(dbres.status_code)This machine is typically using 10w to 20w with Debian 10 with no heavy software in background. This is quite impressive for i7 based desktop.
Once you get enough data points, then you can plot CPU parameters in Grafana.
Related Posts