It is always a good idea to expose Grafana like web apps on network via a standard web proxy. In this write up, I will mention required configuration updates in grafana and apache to achieve this.
Grafana installation by default listens of all network interface IPs on port 3000/tcp.
netstat -nap | grep 3000 | grep -i list

tcp6       0      0 :::3000                 :::*                    LISTEN      15260/grafana-serve
First let us restrict it on loopback IP, 127.0.0.1, change http_addr to loopback IP in grafana.ini
http_addr = 127.0.0.1
Restart grafana service and verify again with netstat command.
/bin/systemctl restart grafana-server.service

netstat -nap | grep 3000 | grep -i list

tcp 0 0 127.0.0.1:3000 0.0.0.0:* LISTEN 15344/grafana-serve
Suppose you want to present grafana on http://YourHostIPorName/reports/ url, then make following updates in apache config.
<Location /reports>
        ProxyPreserveHost On
        ProxyPass http://127.0.0.1:3000
        ProxyPassReverse http://127.0.0.1:3000
</Location>
Restart apache.
Make following changes in grafana.ini and restart grafana as well.
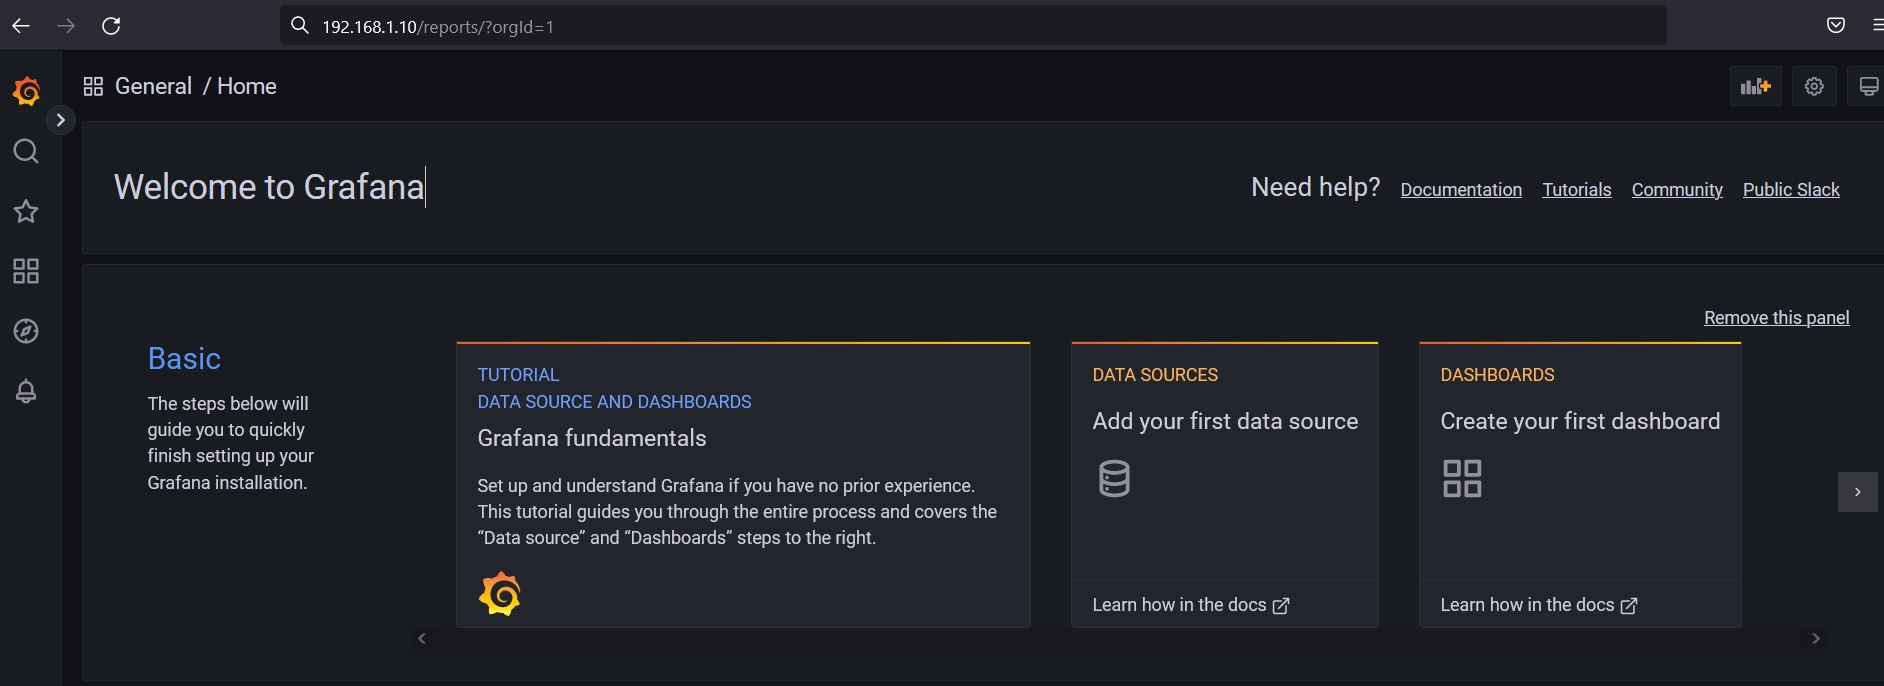
root_url = %(protocol)s://%(domain)s:%(http_port)s/reports/Now you can access grafana on network by hitting http://YourHostIPorName/reports/
Related Posts